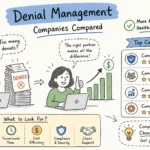


For small practices looking to reduce medical claim denials, the financial stakes are significant. The industry benchmark for denial rates sits at 5, 7%, but small practices routinely run at 10, 15%. Worse, roughly 50, 65% of those denials are never appealed or reworked, meaning lost revenue simply vanishes without a fight. At approximately $100 per denied claim, a practice submitting 500 claims monthly at a 12% denial rate is forfeiting about $6,000 per month, before accounting for revenue never recovered from unappealed denials.
The core problem is structural. Small practices don’t have dedicated billing departments, so denials accumulate quietly while the front desk juggles scheduling, phone coverage, and patient care. Nobody owns the denial queue, appeal deadlines slip, and patterns repeat month after month without a root-cause fix. Practices that work with specialized billing partners can see measurable improvement precisely because those partners build the systems most small teams never have time to create.
This article covers nine specific strategies to cut your denial rate, three KPIs to track every month, and a clear framework for deciding when to manage this in-house versus when to bring in outside help.
Why claim denials cost more than your denial rate shows
The denial rate percentage understates the actual financial damage. When you factor in the claims that are denied and never appealed, the true revenue loss compounds. A practice with a 12% denial rate that appeals only 35% of those denials is effectively writing off 7, 8% of its submitted revenue as uncollectable, and doing so without ever making a formal decision to do so.
Specialty mix defines your baseline risk. Behavioral health runs denial rates around 16%, orthopedics around 13%, cardiology around 12.5%, and family practice around 9%. Payer mix matters just as much. UnitedHealthcare runs approximately 15.6% initial denial rates, while Medicare FFS sits near 5.4%. The same claim submitted to different payers carries a completely different denial risk profile. Knowing your specific payer-specialty combination tells you which combinations to prioritize fixing first, so you’re targeting high-ROI corrections rather than spreading effort evenly across everything.
A focused review of the root causes of Medicare claim denials makes clear how procedural and documentation gaps translate directly into recoverable and unrecoverable revenue.
How to reduce medical claim denials for small practices: front-end strategies
Strategy 1: Eligibility verification at scheduling
Single-point eligibility verification is one of the most common front-end failures in small practices. Insurance coverage changes between scheduling and the visit date regularly, and eligibility-based denials account for 20, 30% of commercial payer denials. Running one check at the start of the month and assuming it holds is how practices get blindsided by inactive coverage on the date of service.
Strategy 2: Eligibility re-verification at check-in
The correct workflow runs a real-time eligibility check at scheduling and again at check-in. Each check should confirm active coverage, copay and deductible status, visit limits, network participation, and coordination of benefits. This takes minutes with any clearinghouse or practice management system that supports real-time eligibility, and it eliminates an entire category of preventable denials before the patient leaves the building. For more on common causes and practical fixes, see a detailed guide to the causes of medical claim denials and how to fix them.
Strategy 3: Prior authorization tracking that doesn’t rely on memory
Prior authorization denials account for 15, 25% of commercial denials, and that number is rising, particularly for behavioral health, orthopedics, and physical therapy. The problem isn’t just getting the authorization; it’s tracking it after you have it. Practices that manage prior auth with sticky notes, phone call logs, and informal follow-up are the most vulnerable, because payer requirements change frequently and there is zero margin for error on expired or insufficient authorizations.
A working tracking system logs the auth number, approval date, expiration date, authorized units or visits, and the payer’s appeal deadline in one place. Every staff member who touches scheduling or billing needs access to this log. When an authorization is about to expire or the visit count approaches the approved limit, the system should trigger a renewal before the claim is submitted, not after it’s denied.
Coding and submission practices that raise your clean claim rate
Strategy 4: Accurate ICD-10 and CPT coding at the source
Coding errors drive 15, 25% of denials across most payer types, and they are almost entirely preventable. The most common triggers are mismatched diagnosis-procedure pairs, missing or incorrect modifiers, improper code bundling, and ICD-10 codes that lack the specificity the payer requires. These errors typically originate from coding by habit rather than coding from complete documentation.
The fix is to code from the note, not from memory, and to validate modifier use against payer-specific rules before submission. Periodic coding audits, even quarterly spot-checks on high-denial CPT codes, catch repeating errors before they compound into months of denied revenue. Fixing a recurring coding error at the source is significantly cheaper than appealing the same denial pattern every month.
Strategy 5: Pre-submission claim scrubbing
A clean claim means every required field is populated, codes are validated, modifiers are applied correctly, and payer-specific edits are cleared before the claim leaves the practice. The industry target for clean claim rates is above 95%. Most small practices operating without a claim scrubber fall well below this benchmark, often without realizing it, because rejections and denials look like separate problems rather than a unified clean-claim failure.
Even a basic clearinghouse with built-in edits catches a meaningful share of preventable rejections before they become formal denials. Tools like Athenahealth, Tebra, and PracticeSuite all include scrubbing functionality at per-provider price points that are manageable for small practices. The goal isn’t a perfect system on day one; it’s catching the high-frequency errors that account for the majority of your preventable denials.
Strategy 6: Timely filing compliance by payer
Timely filing denials are 100% avoidable and typically represent 5, 10% of total denials. These are pure administrative losses with no clinical justification. Medicare generally allows 12 months from the date of service, but commercial payers vary widely, with some requiring submission within 30, 90 days of service. Filing windows differ by payer, plan type, and sometimes by state.
Maintain a payer-specific filing deadline reference document and track submission dates for every claim. This doesn’t require expensive software; a shared spreadsheet updated when you add or renew payer contracts is sufficient. Timely filing denials should appear in your denial tracking as a separate category so you can see if they’re increasing, which would indicate a submission process breakdown rather than a one-off administrative mistake.
A denial response workflow that actually recovers revenue
Strategy 7: Triage every denial within 24, 48 hours
Speed matters in denial management because appeal windows shrink from the moment a denial is received. Many commercial payers have appeal windows of 30, 180 days, but an organized, complete appeal is far easier to build when you start within 48 hours rather than three weeks later. The longer a denial sits in a work queue, the more context is lost and the more the window compresses.
The triage step is straightforward: route each denial to the right person by category within 48 hours of receipt, and log the denial reason code, payer, and appeal deadline in a central tracker. Eligibility denials go to the front desk. Coding denials go to the biller or coder. Authorization denials go to whoever manages prior auth. In many small practices, denials sit unrouted for days or weeks, and that delay is precisely what collapses recovery rates and drives the 50, 65% never-appealed statistic.
Strategy 8: Building an appeals process with a real win rate
Roughly 57% of denied Medicare Advantage claims are overturned on appeal, and commercial payer data shows similar overturn rates near 50, 54%. Those numbers mean a well-executed appeal process genuinely recovers revenue that would otherwise be written off. The key word is “well-executed”: a vague appeal letter with no supporting documentation produces a very different outcome than a structured appeal that directly addresses the payer’s stated denial reason.
A winning appeal includes the denial reason code analysis, supporting clinical documentation, the correct appeal form, and a written argument that maps the clinical evidence directly to the payer’s stated denial reason. After the appeal is resolved, categorize the denial in your tracking log. Patterns that repeat by payer or provider signal upstream process failures, not isolated mistakes, and every repeating pattern should trigger a workflow correction rather than just another appeal. That aligns with research showing insurance denials are often overturned on appeal when supported by targeted documentation, as discussed in a study of overturned denials.
The 3 denial KPIs every small practice should track
KPI 1: Clean claim rate
Clean claim rate is the percentage of claims accepted on the first submission without requiring correction or resubmission. The target is above 95%. This metric is calculable from your clearinghouse or practice management reports and doesn’t require new software to track. Running these numbers monthly by payer tells you which payer relationships are generating disproportionate denials and where to focus process improvement.
KPI 2: First-pass denial rate
First-pass denial rate is tracked by payer and by provider. At 10, 15%, a small practice is significantly above the 5, 7% industry benchmark and well above the sub-5% high-performer target. A spike in first-pass denials from a specific payer often signals a rule change or contract update that your billing process hasn’t caught up to yet, making this metric an early-warning indicator for payer-side changes that require immediate process adjustments.
KPI 3: Appeal overturn rate and days in accounts receivable
Appeal overturn rate reveals whether your denial response process is actually working. If you’re filing appeals and losing most of them, that points to documentation or clinical necessity issues. If your overturn rate is strong but your denial volume is high, the problem is upstream in the front-end or coding process. Days in AR is the downstream impact metric: when denials are resolved quickly, AR days compress. When they pile up, AR days grow, and claims beyond 90 days become increasingly difficult to collect.
These three KPIs together form a monthly dashboard that any practice manager can review in under an hour. Practices that monitor these numbers consistently catch deteriorating trends before they become cash flow crises, rather than discovering a problem six months after it started.
When it makes sense to partner with a specialized billing company
Signs your in-house process has hit its ceiling
Most small practices reach an inflection point where the in-house process can’t improve further without dedicated resources the practice can’t justify hiring. The front desk handles billing as a secondary task, denial patterns keep repeating without root-cause resolution, and nobody has time to build the tracking systems that would fix it. The clearest warning signals are a denial rate above 10%, AR days trending above typical norms for your practice, an appeal rate close to zero, timely filing denials appearing on remittances, and coding errors surfacing repeatedly on the same procedure codes.
Adding a billing staff member to solve these problems is expensive and doesn’t automatically bring the payer-specific expertise needed to reduce denials for small practices systematically. A general biller who is new to your specialty mix will take months to learn the payer nuances that are driving your denial rate, and the practice absorbs that learning curve in continued lost revenue.
How WeBill Health implements these strategies at scale
WeBill Health builds all nine strategies outlined in this article into a managed RCM workflow, covering eligibility verification, prior auth tracking, coding review, claim scrubbing, denial management, and appeals, without the practice having to hire, train, or manage dedicated billing staff. The operational infrastructure is already in place, which means a small practice can access a system that typically takes months to build internally. Similar revenue cycle gains are documented in clinic case studies showing measurable improvements after process redesign; see a practical revenue cycle success story.
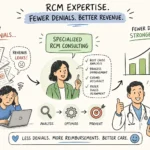
WeBill Health focuses on high-denial-risk specialties including behavioral health, physical therapy, and ABA therapy, where denial rates in these categories have been reported in the 13, 16% range and where payer-specific nuances require deep familiarity with utilization management rules. The approach centers on proactive denial prevention built on detailed knowledge of how payer algorithms and utilization management systems generate denials, not just reactive claims handling after the fact.
The cost comparison: outsourcing vs. in-house billing
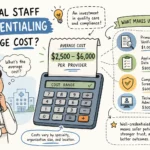
A dedicated in-house biller costs $40,000, $55,000 per year in salary before benefits, training, software, and turnover risk. Outsourcing to a company like WeBill Health typically operates as a percentage of collections, meaning the cost scales with revenue and the practice isn’t paying for idle capacity during slow periods. For a practice collecting $1 million annually, the all-in cost of in-house billing versus outsourced billing often looks very different once denial losses and administrative overhead are factored in.
The practical question for every practice owner is this: what is the current cost of your denial rate in lost revenue, rework hours, and staff stress versus what a specialized partner would cost to fix it? That comparison, done honestly, is usually where the outsourcing decision becomes clear.
Putting it together: how to reduce denials in small practices
The framework works in sequence. Fix the front end first with rigorous eligibility verification and prior auth tracking. Clean up submission with accurate coding, claim scrubbing, and timely filing discipline. Respond to denials within 48 hours. Track three KPIs every month. None of these strategies require new hires. All of them are achievable with process discipline and the right tools.
Moving from a 12% denial rate to under 5% at a 500-claim-per-month practice recovers thousands of dollars monthly. The benchmarks show that the gap between where most small practices operate and where high performers land is largely a systems gap, not a clinical one. The strategies in this article are designed to close that gap and reduce medical claim denials for small practices in a measurable, sustainable way.
If you’d rather implement these systems without building them from scratch, WeBill Health is built to do exactly that. If your denial rate is currently above 7%, it’s worth an honest assessment of whether your current billing process is actually designed to bring it down.