

How do I reduce insurance claim denials for my practice? For most independent and specialty practices, the answer starts with understanding that denials are rarely random. The average U.S. medical practice loses 9, 12% of submitted claims to denials every year. For behavioral health providers, that number climbs to 16%. For orthopedics, it sits at 13%. That’s not a payer problem or a reimbursement rate problem, it’s a process problem, and the majority of it is preventable.
What makes this particularly frustrating is that most medical billing denials aren’t the result of complex clinical disputes. They come from administrative errors: the wrong member ID, a missing modifier, an expired prior authorization, a code that wasn’t updated when CMS released the new year’s fee schedule. At WeBill Health, we see this pattern repeat across independent practices consistently. Once you know what’s causing your denials, you can build a process that stops most of them before they ever leave your office.
This guide walks through the full framework for reducing insurance claim denials for your practice: front-end prevention, coding and documentation controls, a structured appeals workflow, and three KPIs to track whether your changes are actually working.
Why most claim denials are preventable, and what yours are telling you
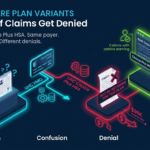
Not all denials are created equal, and treating them as one category is one of the biggest mistakes independent practices make. Denials fall into three buckets, and knowing which one is hitting your practice hardest tells you exactly where to focus first.
The three categories that drive the majority of denial volume
Administrative denials include registration errors, eligibility lapses, coordination of benefits issues, and late filing. These are the most fixable category and should always be addressed before anything else. Clinical denials stem from medical necessity gaps, documentation failures, or experimental treatment flags. Policy denials cover non-covered services, exhausted plan limits, and out-of-network billing situations.
If you don’t know which category is driving most of your volume, pull your denial data by reason code from your practice management system and group it. The answer is usually in the first three codes.
Specialty denial rates worth knowing
Here’s where your practice stands relative to industry benchmarks:
| Specialty | Average denial rate |
|---|---|
| Behavioral health | 16% |
| Anesthesia | 14% |
| Orthopedics | 13% |
| Cardiology | 12.5% |
| Internal medicine | 10% |
| Family practice | 9% |
| Dermatology | 8% |
A denial rate under 5% signals strong revenue cycle performance. Anything above 10% means you have a systemic problem that won’t fix itself. To pull your own rate, divide your total denied claim dollar amount by your total submitted claim dollar amount over the same period. Most practice management systems can generate this report directly.
How to reduce insurance claim denials: front-end checks that stop problems before claims go out
The highest-ROI denial prevention work happens before a patient is ever seen. Eligibility verification and prior authorization are where most administrative denials originate, and they’re also where automation delivers the fastest measurable return.
How to run eligibility verification at every patient contact point
Verify coverage at three points: when the appointment is scheduled, again 48 hours before the visit, and once more at check-in. Each check should confirm active coverage, the correct payer order, plan limits, and whether your rendering provider is in-network with the patient’s specific plan. Eligibility-related issues drive an estimated 10, 20% of all claim denials, which means fixing this category alone can move your overall denial rate by several percentage points.
The labor math also justifies the investment. A mid-size practice processing 300 verifications per day can save more than $700,000 annually in direct transaction costs by moving from manual to automated verification, not counting the downstream reduction in denials and collection costs. Practices that implement automated eligibility workflows typically see a 15, 20% reduction in A/R days within the first two quarters of consistent execution. Implementing dedicated eligibility verification software can automate those three checks and surface coverage issues before claims are created.
Building a prior authorization workflow that doesn’t create bottlenecks
Start by mapping every service line that requires prior auth by payer. This list changes more frequently than most practices realize, so build a quarterly review into your process. Assign clear ownership for each step: who submits, who tracks status, and who escalates when a decision is delayed. Every authorization number must be documented in the patient record before the claim goes out, with no exceptions.
The 2026 federal rule gives you a tool to hold payers accountable: standard prior auth decisions must now be made within 7 days, and urgent requests within 72 hours. If a payer is sitting on an authorization beyond those windows, that’s a violation you can document and reference in your escalation process.
Coding and documentation standards that remove payer arguments
Even when eligibility and authorization are clean, coding errors create a second wave of denials. The same errors tend to repeat across practices, which means a focused audit can identify most of your exposure quickly.
The coding errors that trigger the most denials
Outdated or deleted CPT and ICD-10 codes are a consistent denial trigger. Audit your active code library at least annually, more frequently for specialties that see regular AMA and CMS updates. Diagnosis-procedure mismatches are another high-volume issue: every CPT you bill must be supported by an ICD-10 code with the appropriate specificity, including laterality where required. Vague or unspecified diagnoses invite downcoding and denials even when the clinical documentation is solid. For an overview of the most common root causes of denials, this analysis of common denial causes is a useful reference.
Modifier errors, particularly missing modifier 25, generate a significant volume of entirely avoidable medical billing denials. When a separately billable service is performed on the same date as an evaluation and management visit, modifier 25 must appear on the E&M code and the documentation must clearly support both services as distinct.
NCCI edit conflicts are a related issue. Payers automatically deny code pairs that should be billed as a single comprehensive code, so check your top-volume code combinations against current NCCI edit tables. When you do bill them separately, ensure a valid modifier and supporting documentation are in place.
What documentation must include to survive a payer review
Every note that supports a billed service needs to include severity, specificity, and laterality in the diagnosis documentation; a provider signature with the date; a clear medical necessity rationale; and an explicit link between the diagnosis and the procedure. These aren’t formalities, payers review for exactly these elements when they pull records for a utilization review or audit.
Run a quarterly internal coding audit: pull a sample of 20, 30 claims per CPT category and check for the errors listed above. Frame this as a representative sample, not an exhaustive review. The pattern of what you find will tell you exactly where to focus staff training. One quarter of this discipline typically surfaces more actionable information than a year of reacting to individual denials.
A denial management and appeals workflow that recovers lost revenue
Many practices pile denied claims into a queue and work them inconsistently, or don’t work them at all until they’re close to the appeals deadline. A structured workflow fixes both problems.
Reading remittance advice so you know exactly why each claim denied
Claim Adjustment Reason Codes (CARC) are your first diagnostic tool. CO-16 means missing or incorrect information. CO-29 is a timely filing issue. CO-50 is medical necessity. CO-97 is bundling. CO-197 means prior authorization was missing. Pair each CARC code with the accompanying Remittance Advice Remark Code (RARC) to get the specific fix required for resubmission.
Grouping denials by CARC code on a weekly basis is what separates practices that recover denied revenue from those that write it off. When the same CARC code keeps appearing across multiple patients, you have a systemic problem, not a one-off error.
How to reduce insurance claim denials through a structured appeals process
File within payer deadlines without exception. Appeal windows vary significantly by payer, many commercial plans allow as few as 60 days from the denial date, while others extend longer. Always confirm the specific deadline in each payer’s provider manual before you assume you have time. Medicare Part B follows a separate federal process: redetermination requests must be filed within 120 days of receipt of the initial determination, reconsideration requests within 180 days of the redetermination decision, and subsequent levels within 60 days of each prior decision. Refer to the official Medicare fee-for-service appeals guidance for detailed timelines and submission requirements.
Every appeal package should include the original claim, the denial EOB, a clinical cover letter that addresses the specific denial reason by name, and supporting documentation such as medical records, authorization numbers, and coding rationale. Track every appeal by submission date, follow-up date, and resolution status. When you see a payer repeatedly denying the same service across multiple patients for the same reason, escalate to a formal payer dispute rather than filing individual appeals. Individual appeals rarely change payer behavior; formal disputes create a documented record and often resolve faster.
Three KPIs that tell you whether your denial rate is actually improving
Implementing process changes without tracking outcomes is how practices spend months on improvements and still wonder why their cash flow hasn’t changed. These three metrics give you a clear picture of progress.
Clean claim rate, denial rate, and days in A/R
Your clean claim rate measures the percentage of claims accepted on first submission without rejection or denial. The industry benchmark for strong performance is 95% or higher; top-performing practices push toward 97, 98%. If your clean claim rate is below 95%, your front-end and coding processes need attention before anything else.
Your overall denial rate should be tracked monthly by payer and by denial category. Under 5% signals strong revenue cycle management. Above 10% means a systemic problem that won’t improve without a deliberate process change. Tracking by payer is essential because a 12% denial rate average can hide a single payer causing 40% of your volume.
Days in accounts receivable is your cash-flow indicator. Set a 30-day baseline and measure against it monthly. Practices that implement automated eligibility verification and structured denial workflows consistently see meaningful reductions in A/R days within the first two quarters of execution.
How to build a simple denial tracking dashboard without expensive software
Most practice management systems can already export denial data by date range, payer, and denial reason. The raw data is usually there; it just isn’t being reviewed consistently. Build a spreadsheet that tracks denial volume, dollar amount, CARC code, and resolution status by week. Review it in a standing 30-minute team meeting every week. Reviewing the data together creates accountability and surfaces fixes faster than monthly reporting ever will.
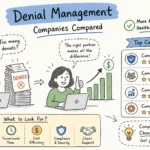
When to stop managing denials in-house and bring in a billing partner
There’s a point where the internal bandwidth required to manage denials properly exceeds what a small practice can realistically sustain. Recognizing that point early saves significant revenue.
Signs your in-house process is costing you more than it saves
- Your denial rate has stayed above 10% for more than two consecutive quarters despite internal fixes
- Appeals are sitting unworked past 60 days because staff don’t have bandwidth
- Coding errors keep repeating in quarterly audits with no clear improvement trend
- Your team is spending more time managing billing problems than supporting patient care
These aren’t signs of a bad team, they’re signs that the volume and complexity of denial management has outgrown what an in-house generalist setup can handle without dedicated resources.
What a turnkey billing partner actually takes off your plate
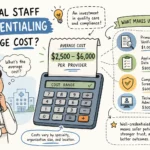
WeBill Health handles every step covered in this guide: eligibility verification at the front end, coding and documentation review, prior authorization tracking, denial management, and appeals submission. For many independent practices without a dedicated billing team, partnering with a specialty-specific RCM firm can be a cost-effective alternative to expanding in-house staff, run a direct comparison using your local wage data and vendor pricing to see where you stand.
The result is a measurably lower denial rate, faster reimbursements, and a practice that can focus on patients instead of payer disputes. If you’re consistently losing revenue to denials that should never have happened, the problem isn’t the payers, it’s the process, and a specialized billing partner addresses both.
Start reducing insurance claim denials with a process that actually works
How do I reduce insurance claim denials for my practice? The answer is a front-to-back discipline. It starts with eligibility verification and prior authorization, runs through tight coding and documentation controls, and finishes with a structured appeals process that works denials systematically rather than reactively. Tracking your clean claim rate, denial rate, and days in A/R gives you real visibility into whether changes are producing results.
For practices that want to skip the setup time and start recovering revenue faster, WeBill Health provides a complete denial prevention and management solution built specifically for independent and specialty practices. The alternative is continuing to absorb denials that, in most cases, are entirely preventable. That’s revenue your practice earned, and a process problem that’s fully within your control to fix.